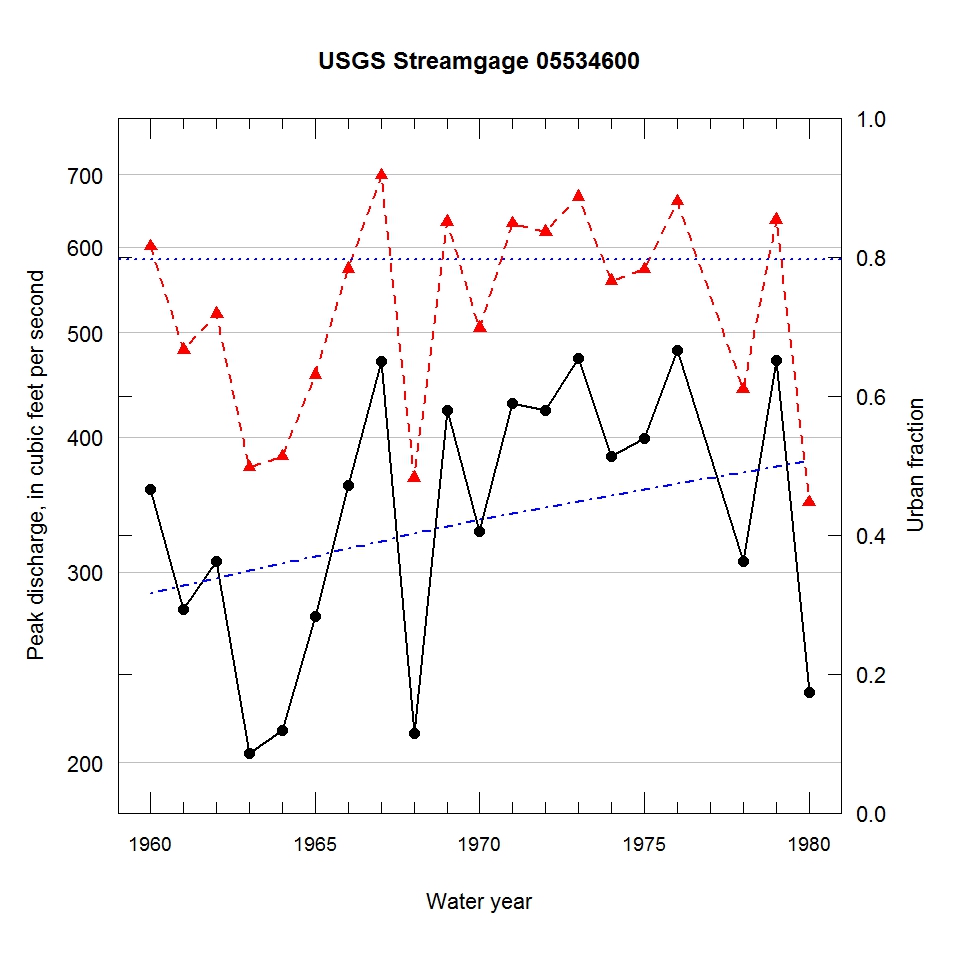
Observed and urbanization-adjusted annual maximum peak discharge and associated urban fraction and precipitation values at USGS streamgage:
05534600 NORTH BRANCH CHICAGO RIVER AT NORTHFIELD, IL


| Water year | Segment | Discharge code | Cumulative reservoir storage (acre-feet) | Urban fraction | Precipitation (inches) | Observed peak discharge (ft3/s) | Adjusted peak discharge (ft3/s) | Exceedance probability |
| 1960 | 1 | -- | 0 | 0.317 | 0.441 | 358 | 601 | 0.370 |
| 1961 | 1 | -- | 0 | 0.327 | 1.257 | 277 | 482 | 0.581 |
| 1962 | 1 | -- | 0 | 0.338 | 0.230 | 307 | 520 | 0.507 |
| 1963 | 1 | -- | 0 | 0.349 | 1.280 | 204 | 375 | 0.783 |
| 1964 | 1 | -- | 0 | 0.359 | 0.802 | 214 | 384 | 0.767 |
| 1965 | 1 | -- | 0 | 0.370 | 0.525 | 273 | 457 | 0.627 |
| 1966 | 1 | -- | 0 | 0.381 | 0.500 | 361 | 573 | 0.416 |
| 1967 | 1 | -- | 0 | 0.391 | 1.407 | 470 | 699 | 0.228 |
| 1968 | 1 | -- | 0 | 0.402 | 0.734 | 213 | 367 | 0.796 |
| 1969 | 1 | -- | 0 | 0.413 | 2.037 | 424 | 633 | 0.315 |
| 1970 | 1 | -- | 0 | 0.423 | 1.799 | 327 | 505 | 0.535 |
| 1971 | 1 | -- | 0 | 0.432 | 0.347 | 430 | 631 | 0.319 |
| 1972 | 1 | -- | 0 | 0.440 | 2.319 | 424 | 620 | 0.338 |
| 1973 | 0 | -- | 600 | 0.448 | 1.232 | 473 | 668 | 0.264 |
| 1974 | 2 | -- | 600 | 0.457 | 1.254 | 384 | 558 | 0.443 |
| 1975 | 2 | -- | 600 | 0.465 | 1.024 | 399 | 572 | 0.419 |
| 1976 | 2 | -- | 600 | 0.474 | 1.299 | 481 | 661 | 0.274 |
| 1978 | 2 | -- | 600 | 0.491 | 1.581 | 307 | 443 | 0.654 |
| 1979 | 2 | -- | 600 | 0.499 | 0.949 | 471 | 636 | 0.309 |
| 1980 | 2 | -- | 600 | 0.508 | 0.600 | 232 | 348 | 0.827 |

